
What Surface Roughness Means and Why It Matters
When you examine a metal component very closely, you will find small hills and valleys on its surface - even if it appears to be smooth by the naked eye. This microscopic texture is what the engineers refer to as surface roughness. It is a term that defines how the surface of a material is more or less even after a manufacturing process like milling, turning, grinding, or polishing.
Such small deviations from the standard might seem insignificant, but they actually have an impact on the performance of the parts in the real world - starting with how they become worn through time and ending with how tightly they can be sealed against another component.
Surface roughness is essentially a numerical representation.
The most common method of representing this is with the Ra value, which stands for average roughness. You can think of Ra as the average of all the tiny peaks and dips along a surface line - it provides you with one single number that engineers can define and measure. The higher the Ra numbers, the rougher is the surface; the lower the Ra numbers, the smoother the surface is.
How Surface Roughness Is Measured
There are several means by which the roughness of a surface may be quantitatively evaluated, dependent upon the instruments and degree of accuracy required:
Contact methods: A stylus is moved over the surface very gently and the amount of the vertical movement is recorded. The data is then used to determine values such as Ra.
Non-contact methods: Laser scanners or optical sensors, for example, can look at the surface without any physical contact, which is also quicker and can prevent the surface from being harmed.
Comparison methods: At times, engineers may just compare the surface by touch or sight to the reference samples of certain roughness.
Each technique is available, however, for exact work in engineering, the use of devices that measure roughness numerically is most suitable.
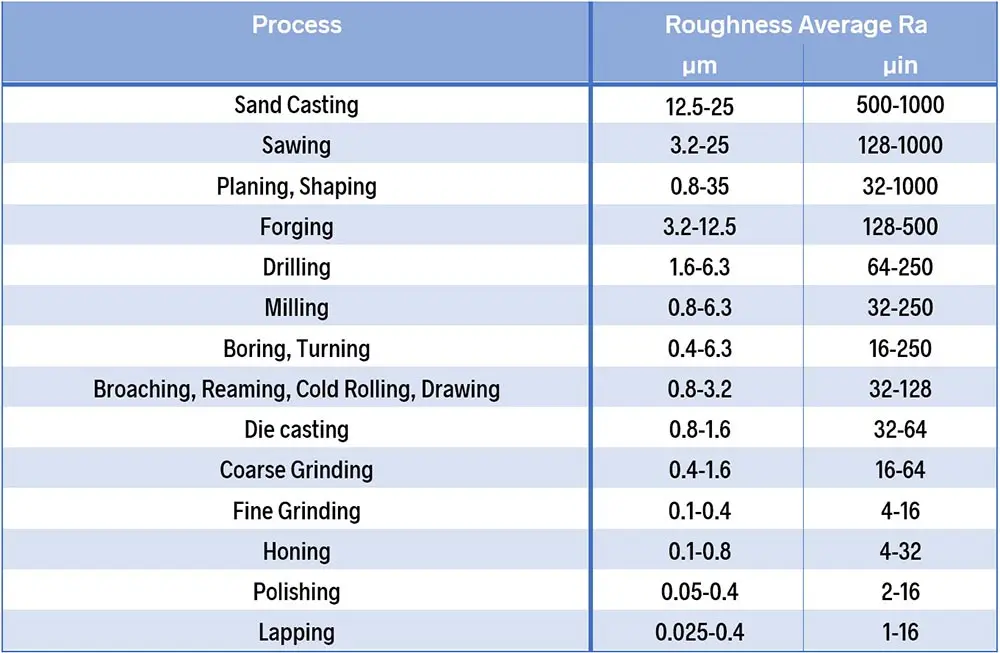
Reading a Surface Roughness Chart
A surface roughness chart is essentially a reference table that associates roughness numbers with the tactile sensation of a surface and the method it was probably made. In case you have come across the charts while viewing CNC machining specifications, the charts that show Ra values alongside standard manufacturing processes are the charts we are referring to.
| Finish Description | Roughness (Ra, µm) | Typical Process |
|---|---|---|
| Very Smooth (near mirror) | 0.02 – 0.1 | Polishing, superfinishing |
| Fine Machined | 0.2 – 1.6 | CNC milling or turning |
| Medium Machined | 1.6 – 6.3 | Rough milling/grinding |
| Rough Cast | 6.3 – 12.5 | Casting surfaces |
You can tell that when the number increases, the surface is likely to be rougher and is generally the outcome of more harsh or less accurate processes.
Such a chart is a tool for designers and machinists to determine the actual finish required for a certain part. For example, a rotating shaft in a bearing might require a lower Ra value for smooth operation, while a bracket that is fixed by a bolt may not need such a fine surface.
Symbols and Notes on Technical Drawings
Surface roughness is more than just a figure on the map of an engineer — most of the time, it is represented by the characters. The global standards (such as ISO and some ANSI guidelines) characterize the shape of the signs in such a way that a technician from any part of the world has the identical understanding of them.
Typical surface finish symbol could have:
- The Ra value
- The lay direction (the pattern left by cutting)
- Optional notes about special processing
This, in essence, helps the maker of the part understand exactly what finish the designer is after.
Why These Details Matter
You may ask why would anyone be interested in such a tiny number as 0.4 µm versus 1.6 µm. However, the surface roughness influence more that just the looks of “a nice” part:
- Wear and friction: Generally, a smoother surface will wear more uniformly and with lower friction.
- Sealing: Surfaces that fit each other (like between a gasket and a housing) seal better when finer.
- Performance: Long-term high-precision gears, shafts, and bearings usually depend on proper roughness for their durability.
These are not merely long-term conceptual models — they can be found in everyday products, such as bicycle parts, and aerospace components.
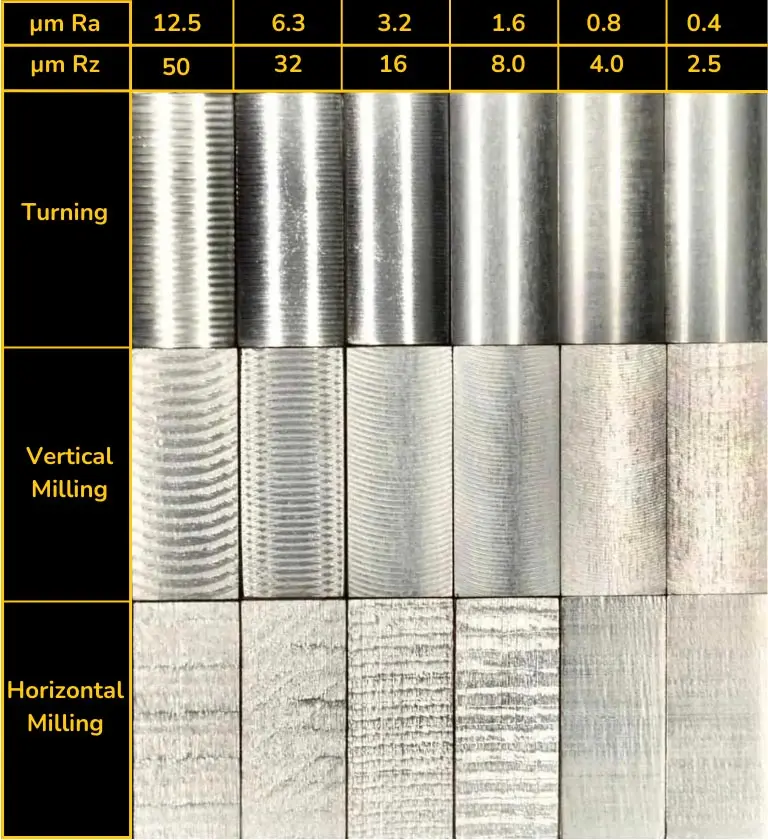
Real-World Roughness Numbers
Just to give you an idea of how these numbers translate into reality:
- Typical machining could result in a surface of about 3.2 µm Ra — you can see the tool marks, but it is still acceptable for most structural parts.
- Closer clearances and smoother surfaces are usually between 0.8 and 1.6 µm Ra.
- Almost polished surfaces — for example, optical or sealing surfaces — can be lower than 0.2 µm Ra after some specialized finishing.
These bands allow the different departments to decide on the tooling, speeds, feeds, and even the choice of an additional finishing operation like grinding or buffing.
Summary
Surface roughness is one of those tiny things that can greatly influence the final outcome. Roughness is basically a number that shows how a surface is either very smooth or has some texture. The engineers utilize diagrams to correlate such figures with operations and requirements for the product's performance.
Knowing these figures help you as a designer or a quality controller to have more control over your work and be able to rely on it.
Natural human-style summary
Surface roughness charts are one of the ways to quantify the quality of a surface by converting the human perception of surface smoothness or roughness into a number that engineers can use. Understanding the difference between a 0.8 µm finish and a 3.2 µm finish is a great challenge impinging the problem solving when it is necessary for parts to fit together, move smoothly or be durable.
Tone/style descriptors
- conversational
- clear and grounded
- practical and relatable
- technically informative without jargon
- example-driven