
Surface Roughness: Ra vs Rz Explained in Detail
In precision manufacturing, the surface finish of a component is a critical design feature. To the naked eye, a machined part may appear perfectly smooth. However, on a microscopic level, its surface is a complex landscape of peaks and valleys. The measurement of these microscopic textures is called surface roughness. This is not just a cosmetic concern; it is a functional characteristic. It directly impacts a part's performance, durability, and reliability. For engineers, specifying the correct surface roughness parameter is essential. The two most common parameters used are Ra and Rz.
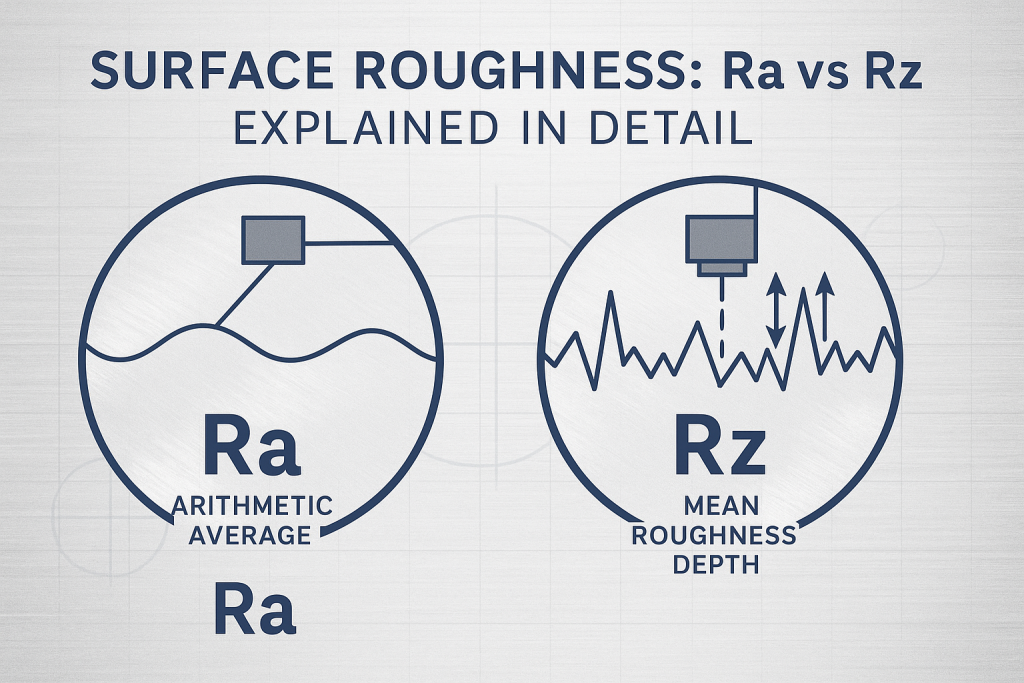
The main difference is that Ra measures the average roughness across a surface, providing a general overview of the texture, while Rz measures the average of the highest peaks and lowest valleys, making it more sensitive to individual scratches or imperfections. Choosing between them depends entirely on the functional requirements of the part.
As an expert in precision CNC machining and surface finish control, GD-Prototyping has deep experience in achieving and verifying specific surface roughness values. This guide provides a comprehensive technical explanation of Ra and Rz. It will empower you to select and specify the correct parameter for your components.
What is Surface Roughness and Why Does It Matter?
Every manufacturing process, from milling and turning to grinding and polishing, leaves a unique texture on a part's surface. This texture, or roughness, is a measure of the fine-scale variations on a surface. It is distinct from waviness (wider-spaced variations) and form (the overall shape of the part). Imagine looking at the ocean from a plane. The overall curve of the earth is the "form." The large swells are the "waviness." The small ripples on the surface of those swells are the "roughness."
The Functional Impact of Surface Roughness
The microscopic peaks and valleys on a surface have a profound impact on how a part functions in a mechanical system.
- Friction and Wear: Smoother surfaces generally have lower coefficients of friction. They wear more slowly than rough surfaces. This is critical for moving parts like bearings, pistons, and gear teeth.
- Fatigue Life: Rough surfaces, especially those with sharp valleys, can act as stress concentrators. These points can become the origin of microscopic cracks that propagate over time, leading to fatigue failure. A smoother surface can significantly increase a part's fatigue life.
- Sealing Performance: For components that use gaskets or O-rings, a single deep scratch across a sealing surface can create a leak path. The overall average roughness is less important than the presence of these extreme defects.
- Adhesion and Coating: The texture of a surface affects how well paints, platings, and other coatings adhere to it. A surface that is too smooth may not provide enough "tooth" for a strong bond, while a surface that is too rough may cause cosmetic issues.
- Aesthetics: In many applications, surface finish is a key part of a product's visual and tactile appeal. A smooth, uniform finish communicates quality and precision to the end user.
Understanding Ra – The Arithmetic Average Roughness
Ra is the most widely used surface roughness parameter in the world. It is the default on many engineering drawings due to its simplicity, stability, and historical prevalence. The "a" in Ra stands for "arithmetic average."
How is Ra Calculated?
Ra is measured using a device called a profilometer. This instrument has a very fine diamond-tipped stylus that is dragged across the surface of the part over a defined distance, called the sampling length. As the stylus moves, it traces the microscopic peaks and valleys of the surface.
The instrument's software first establishes a mean line through the measured profile. This line is positioned so that the total area of the peaks above the line is equal to the total area of the valleys below it. Ra is then calculated as the arithmetic average of the absolute distances of the profile from this mean line.
In simpler terms, the calculation takes every peak height and every valley depth, makes them all positive values, and then calculates the average. The result is a single number that represents the overall, average texture of the surface.
What Ra Tells You (Its Strengths)
The primary strength of Ra is its stability and repeatability. Because it is an average of thousands of individual points along the sampling length, it is not overly influenced by a single unusual peak or valley. This makes it an excellent parameter for general process control. If a manufacturer is consistently producing parts with the specified Ra value, it is a good indication that their machining process is stable and under control. It provides a simple, single-number snapshot of the surface's general condition.
What Ra Hides (Its Limitations)
The greatest strength of Ra—its averaging nature—is also its greatest weakness. Two surfaces with dramatically different performance characteristics can have the exact same Ra value.
Consider two surfaces, both with an Ra of 1.6 µm:
- Surface A: A consistent, uniform profile with evenly spaced peaks and valleys of a similar height. This surface would be ideal for many applications.
- Surface B: A very smooth, finely machined surface that has a single, deep scratch from a broken tool insert.
The averaging nature of the Ra calculation can "smooth over" the effect of the single deep scratch on Surface B. The overall average height may still be 1.6 µm. However, in a real-world application, that one scratch could cause a seal to fail, a crack to form, or a cosmetic rejection. Ra, by itself, cannot distinguish between these two very different surfaces. This limitation is why other parameters, like Rz, are necessary.
Understanding Rz – The Mean Roughness Depth
Where Ra provides a general overview, Rz provides a more detailed picture of the surface's extreme characteristics. The "z" in Rz refers to the profile's height. It is specifically designed to be more sensitive to the highest peaks and the lowest valleys, which are often the features that cause part failure.
How is Rz Calculated?
The most common method for calculating Rz is the "10-point height" method, as defined in standards like ISO 4287. The process is more involved than the Ra calculation.
- The profilometer measures a profile over a total evaluation length.
- This length is divided into five equal, consecutive sampling lengths.
- Within each of the five sampling lengths, the instrument identifies the single highest peak (Rp) and the single lowest valley (Rv).
- The peak-to-valley height for that sampling length is calculated (Rpi + Rvi).
- This is repeated for all five sampling lengths.
- Rz is then calculated as the arithmetic average of these five individual peak-to-valley heights.
Essentially, Rz represents the average maximum roughness depth across five different sections of the surface.
Why Rz is More Sensitive to Extremes
Because the Rz calculation is based only on the highest and lowest points, it is extremely sensitive to outliers. A single deep scratch or a prominent burr that might be averaged out by an Ra measurement will have a significant impact on the Rz value. This makes Rz a much better indicator of surface imperfections that could affect performance. It directly measures the features that are most likely to cause problems.
When is Rz the Preferred Parameter?
Rz is the preferred parameter for many critical applications where individual surface defects cannot be tolerated.
- Sealing Surfaces: A single deep scratch can create a leak path for a gasket or O-ring. Rz will detect this scratch where Ra might not.
- Bearing and Journal Surfaces: A high peak on a bearing surface can break through the lubrication film, causing seizure and failure. Rz controls for these high peaks.
- Press-Fit Components: The quality of a press-fit relies on consistent surface contact. A prominent burr (a high peak) can prevent proper assembly or create a stress point.
- High-Fatigue Applications: Sharp, deep valleys are the primary initiation sites for fatigue cracks. Rz provides a direct measure of the depth of these critical features.
How Manufacturing Processes Affect Ra and Rz
The final surface roughness of a part is a direct result of the manufacturing process used to create it. A top-tier machining partner like GD-Prototyping can achieve a wide range of finishes by selecting the right process.
- Milling and Turning: These processes use a cutting tool to remove material. They inherently leave a regular pattern of tool marks on the surface. The resulting Ra and Rz values can be controlled by adjusting the feed rate, cutting speed, and tool nose radius.
- Grinding and Lapping: These are abrasive finishing processes that remove very small amounts of material. They are used to create extremely smooth and accurate surfaces with very low Ra and Rz values, often required for high-precision components.
- Blasting (Abrasive Finishing): These processes use a high-velocity stream of media to impact the surface. This creates a uniform, non-directional matte texture. The choice between processes like Bead Blasting vs Sandblasting will produce very different surface roughness characteristics and cosmetic appearances.
The Ra to Rz Conversion Chart
Engineers often need to estimate one value from the other. It is critical to understand that there is no perfect mathematical conversion between Ra and Rz. The relationship between them is empirical. It depends heavily on the manufacturing process used to create the surface. For example, a ground surface will have a different Ra-to-Rz ratio than a milled surface.
The following chart should be used as an estimation only for typical machined surfaces.
| Ra (microns, µm) | Ra (microinches, µin) | Estimated Rz (microns, µm) |
| 0.025 | 1 | ~0.2 |
| 0.05 | 2 | ~0.35 |
| 0.1 | 4 | ~0.6 |
| 0.2 | 8 | ~1.1 |
| 0.4 | 16 | ~2.1 |
| 0.8 | 32 | ~4.2 |
| 1.6 | 63 | ~8.0 |
| 3.2 | 125 | ~15.0 |
| 6.3 | 250 | ~27.0 |
| 12.5 | 500 | ~45.0 |
| 25 | 1000 | ~80.0 |
Glossary of Surface Finish Terms
- Profilometer: The instrument used to measure surface roughness.
- Stylus: The fine, diamond-tipped pin on a profilometer that traces the surface.
- Cutoff Length: The length over which a single sample of the surface is measured. Also called the sampling length.
- Mean Line: A reference line established by the instrument, representing the average of the profile.
- Peak: A point on the surface profile that is above the mean line.
- Valley: A point on the surface profile that is below the mean line.
- Roughness: The finest (shortest wavelength) variations on a surface.
- Waviness: The more widely spaced (longer wavelength) variations on a surface.
- Ra: Roughness Average. The arithmetic average of the profile deviations from the mean line.
- Rz: Mean Roughness Depth. The average of the five highest peaks and five lowest valleys over five sampling lengths.
- Rmax: The maximum peak-to-valley height within a single sampling length.
Conclusion
The choice between Ra and Rz is a critical decision in mechanical design. It is about communicating the precise functional intent for a surface. Ra provides a simple and stable method for general process control, making it ideal for the majority of non-critical surfaces. Rz provides a more nuanced and sensitive measurement, offering strict control over the extreme peaks and valleys that can lead to part failure in critical applications.
Understanding the difference between these two parameters is a hallmark of an experienced engineer. Partnering with a manufacturer that has deep expertise in both achieving and measuring these finishes is essential for success. At GD-Prototyping, our team can meet any surface finish specification, ensuring your parts perform exactly as designed.