
Complete Surface Roughness Chart Guide for Precision Machining
Understanding real surface roughness values — Ra, Rz, how to measure them, and how to specify them for precision CNC machining, prototyping, and production parts.
In precision manufacturing, achieving the correct surface roughness is as critical as hitting dimensional tolerances. Surface finish impacts part functionality, wear, sealing performance, friction, and aesthetics. Engineers, designers, and buyers must understand how surface roughness is measured, how to interpret the standard surface roughness chart, and how to apply these specifications in real projects to ensure fit, function, and cost‑effective production.
This in‑depth guide explains the key parameters, the meaning of surface finish symbols, how to read charts, and how GD Prototyping applies strict control over surface roughness in machining and prototyping.
What Is Surface Roughness and Why It Matters
Surface roughness refers to the microscopic texture left on a part’s surface after machining. Even surfaces that look smooth to the naked eye contain tiny peaks and valleys created by cutting tools, material behavior, and machining conditions. These microscopic irregularities have a measurable profile that influences how parts interact in assemblies.
In engineering language, surface roughness is not about visual appearance alone — it defines performance characteristics:
-
Friction and wear — smoother surfaces reduce friction and improve life in sliding applications.
-
Sealing performance — sealing surfaces often require low roughness to prevent fluid or gas leakage.
-
Part assembly — fit between mating parts can be sensitive to surface texture.
-
Functional aesthetics — consumer and industrial products benefit from finishes that reflect quality.
Without specifying surface roughness clearly on technical drawings, manufacturers risk inconsistent outcomes and unexpected costs.
Key Parameters: Ra, Rz, and More
Surface roughness uses quantitative parameters to define how smooth or textured a surface is. These numbers are often shown on engineering drawings.
Ra — Roughness Average
Ra (Arithmetic Average Roughness) measures the average height deviations of peaks and valleys from the mean line across a surface. It is the most commonly used parameter because it gives a simple, consistent value that’s easy to specify and measure.
Rz — Mean Roughness Depth
Rz measures the vertical distance between the highest peak and lowest valley over multiple sampling lengths. It captures extreme surface deviations that Ra alone might not show, making it helpful for surfaces with occasional deep marks.
Other Parameters
Additional indicators like Rq (root mean square roughness), Rsk (skewness), and Rt (total roughness) are used in advanced surface analysis, but Ra and Rz remain the industry standards for most machining applications.
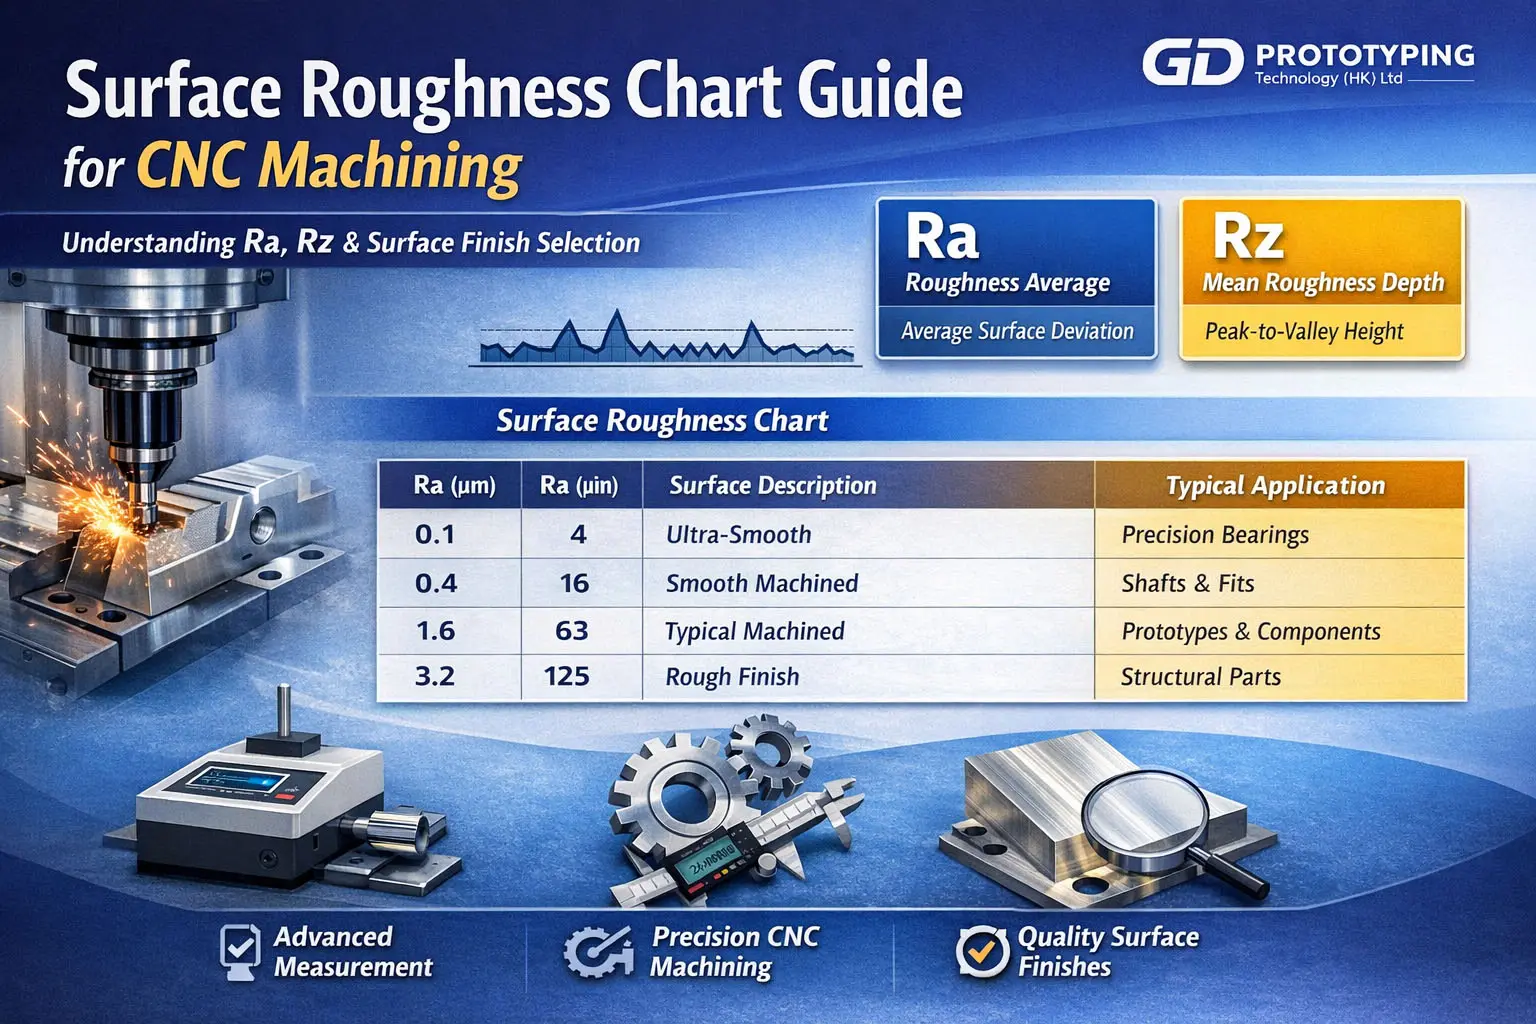
Standard Surface Roughness Chart
Surface roughness charts list common Ra values with equivalent roughness descriptions, typical manufacturing processes, and applications. These charts help engineers choose roughness requirements that balance performance and cost.
| Ra (µm) | Ra (µin) | Surface Description | Typical Application |
|---|---|---|---|
| 0.025 | 1 | Super mirror finish | Precision optics, aerospace seals |
| 0.1 | 4 | Ultra‑smooth | Precision bearings |
| 0.4 | 16 | Smooth machined surface | Shafts, fits |
| 0.8 | 32 | Standard machined finish | General mechanical parts |
| 1.6 | 63 | Typical machined surface | Prototypes, non‑critical components |
| 3.2 | 125 | Rough machined surface | Structural and basic prototypes |
| 6.3 | 250 | Very rough | As‑cast or minimally machined surfaces |
For most CNC milled or turned parts, a surface roughness of Ra 3.2 µm is considered a standard finish, achievable without secondary operations.
How Surface Roughness Is Measured
Accurate measurement of surface roughness ensures that parts meet functional requirements. Two main categories of measurement are:
Contact Profilometry
A stylus with a diamond tip travels over the surface, recording height deviations. Contact profilometers are widely used because they offer reliable quantitative measurements for metals and harder materials.
Non‑Contact Optical Methods
Optical or laser‑based systems scan the surface without touching it, ideal for delicate parts, soft materials, or when a high throughput is needed.
Measurement methods are selected based on material, tolerance, and part function.
Surface Finish Symbols in Technical Drawings
Engineering drawings use specific symbols to define surface finish requirements clearly. A typical surface roughness symbol includes:
-
The basic symbol (check mark).
-
The Ra value or another specified roughness parameter.
-
Optional symbols that indicate lay, machining method, or additional instructions.
Clear communication through symbols helps manufacturers avoid misinterpretation and ensures repeatable surface quality.
Typical Surface Roughness in Manufacturing Processes
Different manufacturing processes have inherent surface roughness ranges:
-
CNC Milling and Turning — Standard machine finishes around Ra 3.2 µm, depending on cutter feed and speed.
-
Grinding — Can achieve Ra 0.8 µm or smoother with fine wheels.
-
EDM — Produces unique textured surfaces, often needing polishing for smoother finishes.
-
Polishing and Lapping — Achieve superfine finishes (Ra < 0.2 µm) for optics or implant surfaces.
Selecting the right process depends on part function and cost targets.
Choosing the Right Surface Roughness for Your Project
When specifying surface roughness, consider:
Functionality
Critical interfaces like sealing surfaces and bearing fits often demand low Ra values (e.g., 0.4–1.6 µm) to reduce leakage and wear.
Cost
Finer finishes incur more time, precision tooling, and potentially secondary processes such as polishing. Balance function and cost based on end‑use.
Material
Different materials respond differently to machining. Softer materials may smear and require adjusted feeds for low roughness. Hard materials may need specialized tooling.
GD Prototyping’s Approach to Surface Roughness Control
At GD Prototyping, controlling surface roughness is integral to precision prototyping and production machining. We leverage:
-
Advanced CNC systems with optimized feeds and speeds to reliably meet specified Ra and Rz values.
-
Inspection and verification using profilometers and metrology tools to confirm finish requirements.
-
Surface treatments aligned with functional needs — from precision machining finishes to deburring, sanding, and cosmetic enhancements.
This ensures parts not only meet dimensional tolerances but also deliver the performance expected in real applications.
Conclusion
Understanding surface roughness and how to use surface roughness charts empowers engineers and manufacturers to make informed decisions about part quality and cost. Clear specifications, accurate measurements, and proper manufacturing planning help produce reliable, functional parts that perform as intended.
Whether you are prototyping or preparing for production, investing time in designing surface finish requirements will reduce surprises, improve performance, and control costs.
For precision parts and dependable surface finishes, GD Prototyping delivers expertise and quality control that meet the most demanding surface roughness specifications.